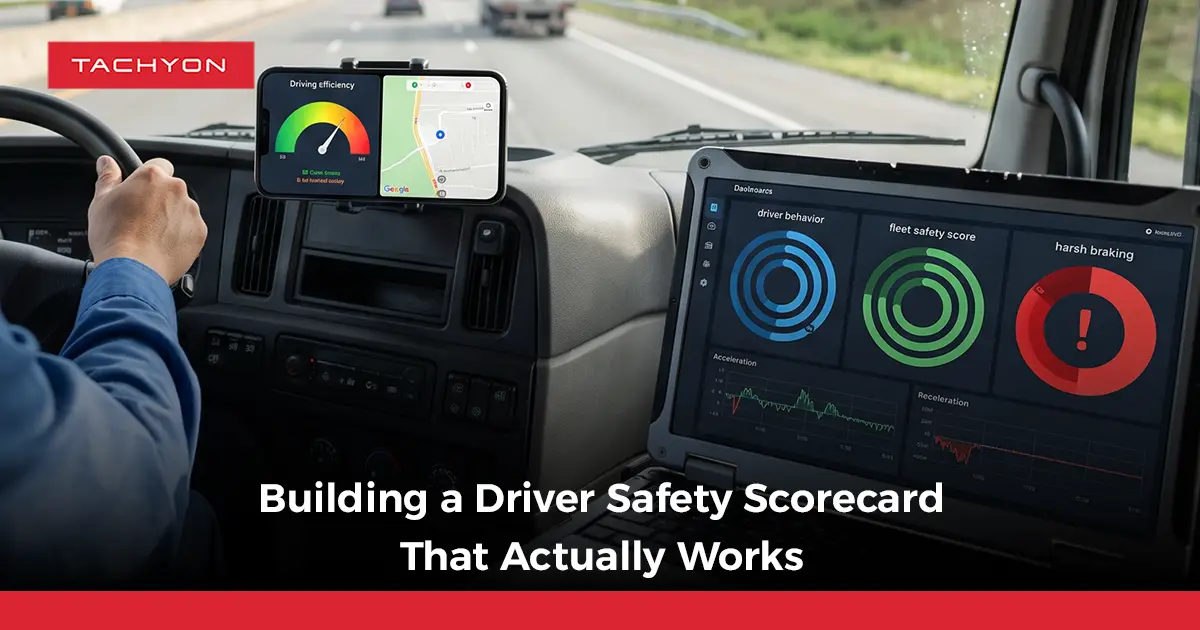
A driver safety scorecard turns driving events into a structured view of risk, helping fleet managers identify unsafe patterns, compare performance fairly, and decide where coaching is needed.The strongest scorecards combine driver behaviour monitoring, contextual event analysis, fleet safety KPIs, and a repeatable driver coaching program rather than treating every safety event as equally important.
What Is a Driver Safety Scorecard?
A driver safety scorecard combines selected driving behaviours and safety indicators into a consistent performance view for each driver. Its purpose is not simply to rank drivers, but to identify risk patterns and measure whether performance improves over time.
Behaviour-Based Performance: Tracks events such as speeding, harsh braking, rapid acceleration, distraction, or other configured safety behaviours.
Exposure-Adjusted Results: Compares event rates against distance, driving hours, trips, or another exposure measure rather than raw totals alone.
Risk Weighting: Gives more importance to behaviours that represent greater or more controllable safety risk.
Trend Visibility: Shows whether a driver is improving, remaining stable, or developing repeated unsafe patterns.
Fleet Benchmarking: Compares individual performance with team, branch, vehicle class, or overall fleet results.
Coaching Priority: Helps managers identify which drivers and behaviours deserve attention first.
Follow-Up Measurement: Tracks what happens after coaching so managers can determine whether the intervention worked.
Motive’s current safety model similarly combines multiple unsafe behaviours, configurable weighting, performance ranges, and exposure-adjusted event rates rather than relying only on total event counts.
Driver Safety Scorecard vs Driver Behaviour Dashboard
Comparison Area
Driver Behaviour Dashboard
Driver Safety Scorecard
Main Purpose
Shows current driving events and activity.
Converts selected behaviours into measurable safety performance.
Time Focus
Often focused on current or recent activity.
Tracks performance across a defined scoring period.
Driver Comparison
May show events by driver.
Supports standardized comparison between drivers.
Risk Weighting
Events may appear individually.
Different behaviours can receive different risk weights.
Exposure Adjustment
May show raw event counts.
Can normalize results by mileage, hours, or trips.
Coaching Use
Helps managers investigate events.
Helps prioritize drivers and topics for coaching.
Trend Measurement
Shows changes in behaviour data.
Measures whether the driver’s overall safety performance improves.
Management Value
Operational visibility.
Performance management and safety improvement.
A driver safety software environment becomes more valuable when behavioural events are translated into clear management priorities rather than displayed as disconnected alerts. TachyonFMS currently includes driver behaviour monitoring for risky events such as harsh braking and distraction.
Which Behaviours Should Be Included in a Driver Safety Scorecard?
Speeding: Measures repeated or significant operation above defined speed thresholds.
Harsh Braking: Identifies sudden deceleration events that may indicate aggressive driving, inadequate following distance, or reactive driving conditions.
Rapid Acceleration: Highlights aggressive acceleration that may increase risk, fuel usage, and vehicle stress.
Sharp Cornering: Identifies turns taken with excessive force or speed where telematics data supports detection.
Distracted Driving: Tracks distraction-related events where appropriate monitoring technology is available.
Route Compliance: Measures repeated unexplained deviation from planned or approved routes.
Excessive Idling: Adds an efficiency and driving-discipline indicator where it is relevant to fleet objectives.
Repeated Safety Events: Highlights drivers generating the same unsafe behaviour across multiple trips or periods.
Motive groups safety performance around several behaviour categories, including harsh driving, speeding, violations, and driver awareness, while Tachyon already monitors selected risky driver behaviours within its FMS.
Why Should Driver Scores Use Rates Instead of Raw Event Counts?
Raw event totals can unfairly penalize drivers who spend more time on the road. A driver completing significantly more kilometres or trips naturally has more opportunities to generate events.
1. Normalize Events by Driving Exposure
Calculate behaviour frequency against kilometres driven, driving hours, trips, or another relevant exposure measure.This makes comparison more meaningful when drivers have different workloads.
2. Compare Similar Operating Profiles
Long-haul drivers should not automatically be judged against urban multi-stop drivers when their operating environments create different exposure.Use comparable groups where fleet size and data allow it.
3. Avoid Ranking Drivers From Small Samples
A driver with only a few trips can appear unusually good or bad because one event has a large statistical effect.Set a minimum data threshold before using the score for formal comparison.
4. Keep the Measurement Unit Consistent
If harsh braking is measured per distance, use the same method across drivers included in that comparison.Changing denominators between drivers weakens the value of the scorecard.
How Should a Driver Safety Score Be Calculated?
There is no single universal formula that every fleet should use. A practical model should reflect the company’s risk priorities, available data, vehicle types, and operating conditions.
1. Select the Safety Behaviours
Choose indicators that can be measured consistently and are relevant to fleet risk.Avoid adding metrics simply because the telematics platform can produce them.
2. Convert Events Into Comparable Rates
Turn raw events into rates based on distance, hours, trips, or another consistent denominator.This reduces bias caused by differences in driver exposure.
3. Assign Risk Weights
Higher-risk or more controllable behaviours can receive greater influence on the final score.Weights should reflect fleet safety priorities rather than being selected arbitrarily.
4. Define a Scoring Period
Use a rolling or fixed period that provides enough data to identify patterns without allowing very old events to dominate current performance.
5. Establish Performance Bands
Translate the numerical result into understandable categories such as Strong, Monitor, Coaching Required, or High Priority.The category should guide action rather than act only as a label.
6. Review Exceptions
Allow managers to investigate events that may have been unavoidable, incorrectly detected, or strongly influenced by road conditions.
7. Recalculate Consistently
Use the same rules and frequency for all drivers within the same comparison group.Consistency makes trend analysis more reliable.
Example Driver Safety Scorecard Structure
The following is an illustrative model, not a universal industry formula:
Safety Metric
Example Measurement
Example Weight
Management Purpose
Speeding Events
Events per distance driven
25%
Identify repeated speed-related risk.
Harsh Braking
Events per distance driven
20%
Detect reactive or aggressive braking patterns.
Rapid Acceleration
Events per distance driven
10%
Monitor aggressive vehicle handling.
Sharp Cornering
Events per distance driven
10%
Identify potentially unsafe turning behaviour.
Distraction Events
Verified events per driving period
20%
Prioritize avoidable attention-related risk.
Route / Safety Compliance
Percentage of compliant trips
10%
Measure operational discipline.
Repeated Behaviour
Recurring events after coaching
5%
Identify whether unsafe habits persist.
The exact weights should be adapted to the fleet. Motive, for example, allows configurable behaviour weights and thresholds, showing why scorecard design should reflect the specific safety priorities of an operation rather than using one rigid formula.
How Should Harsh Braking Analysis Be Used in a Scorecard?
1. Measure Frequency, Not Only Total Events
Harsh braking analysis should consider how often braking events occur relative to the driver’s exposure.Ten events across a very large distance may represent a different pattern from ten events during a small number of trips.
2. Review Event Severity
Not every braking event represents the same level of risk.Where the system provides severity information, use it to prioritize which events deserve investigation.
3. Check Route and Traffic Context
Heavy urban traffic, emergency situations, steep roads, or recurring hazardous locations may influence braking behaviour.Context prevents a scorecard from turning a necessary defensive action into an automatic penalty.
4. Look for Repeated Patterns
A single event may need review, but repeated harsh braking across many trips can indicate following-distance, speed-management, or anticipation issues.
5. Compare Before and After Coaching
The key question is whether the rate decreases after targeted feedback.That makes harsh braking a measurable coaching KPI rather than simply an alert count.Motive’s harsh-driving documentation also treats harsh braking as a behaviour that should be reviewed with event context and allows inaccurate or unavoidable events to be excluded from safety scoring.
Which Fleet Safety KPIs Should Appear on the Scorecard?
Safety Event Rate: Measures total relevant safety events against a consistent exposure unit.
Speeding Rate: Tracks repeated speeding behaviour across the measurement period.
Harsh Braking Rate: Measures sudden braking frequency relative to driver exposure.
Post-Coaching Improvement: Compares behaviour before and after intervention.
Driver Safety Trend: Shows whether overall performance is improving or declining.
Fleet Average Comparison: Provides context by comparing the driver with a relevant peer group.
High-Severity Event Count: Separates serious events from routine low-level exceptions.
Safe-Driving Recognition: Identifies consistently strong drivers for recognition or incentive programs.
Raw Safety Events vs Fleet Safety KPIs
Raw Event
Better Safety KPI
18 harsh braking events
Harsh braking events per defined distance
12 speeding alerts
Speeding event rate plus severity
5 distraction events
Verified distraction rate by driving exposure
25 total alerts
Weighted safety-event rate
7 events this week
Current rate compared with previous period
4 drivers with alerts
Percentage of drivers above risk threshold
20 coaching sessions
Percentage showing improvement after coaching
A scorecard becomes more useful when fleet safety KPIs explain frequency, severity, trend, and improvement rather than presenting isolated totals.
How Do You Turn a Safety Score Into a Driver Coaching Program?
1. Identify the Priority Behaviour
Start with the behaviour creating the greatest or most repeated risk instead of discussing every event at once.Focused coaching gives the driver a clear improvement target.
2. Review Specific Evidence
Use telematics records, timestamps, location context, or available event details to explain what happened.Specific feedback is more actionable than telling a driver to “drive more safely.”
3. Agree on the Expected Behaviour
Explain what safe performance should look like and which measurable indicator needs improvement.The driver should understand how future progress will be assessed.
4. Set a Follow-Up Period
Give the driver enough operating time to demonstrate a new pattern before reassessing the metric.
5. Compare the Same KPI Again
Measure the behaviour using the same denominator and scoring rule applied before coaching.This makes improvement easier to verify.
6. Escalate Repeated Risk
If the same unsafe behaviour continues, move to additional coaching, training, supervision, or the fleet’s established safety process.
7. Recognize Improvement
A driver coaching program should also recognize drivers whose performance improves rather than functioning only as a penalty system.Current Motive coaching workflows similarly connect safety events with specific drivers, coaching history, follow-up, and performance trends.
Rapidly Declining Scores: A sudden downward trend may require faster investigation than a stable moderate score.
Repeated Post-Coaching Behaviour: Give attention to drivers who continue the same behaviour after previous coaching.
Multiple Risk Categories: Drivers showing several unsafe patterns may require broader intervention.
High Exposure With Rising Event Rates: Increasing rates matter even when total mileage is high.
Significant Peer-Group Deviation: A driver performing far below comparable drivers may deserve review.
Newly Emerging Risk: Early intervention can prevent a new pattern from becoming established.
How Often Should a Driver Safety Scorecard Be Reviewed?
Review Frequency
Best Use
Real Time
Critical alerts and events requiring immediate attention.
Daily
Reviewing serious exceptions and operational safety issues.
Weekly
Identifying drivers and behaviours that may require coaching.
Monthly
Comparing safety trends, coaching outcomes, and fleet KPIs.
Quarterly
Reviewing scoring rules, weights, targets, and program effectiveness.
A scorecard should not encourage managers to react to every small daily change. The review frequency should match the severity and purpose of the metric.
How Can Driver Behaviour Monitoring Improve Fuel and Vehicle Performance?
Driving behaviour affects more than safety. Harsh acceleration, unnecessary idling, speeding, and aggressive driving can also influence fuel consumption and vehicle stress.
Harsh Acceleration: Repeated aggressive acceleration can increase unnecessary fuel demand.
Harsh Braking: Frequent braking may indicate inefficient speed control or traffic anticipation.
Excessive Idling: Long idle periods consume fuel without productive vehicle movement.
Speeding: Higher speeds can reduce fuel efficiency and increase safety exposure.
Aggressive Driving Patterns: Repeated acceleration and braking can add unnecessary mechanical stress.
Behaviour Trends: Combining safety and fuel data can show whether coaching improves more than one operational KPI.
Tachyon already discusses driver behaviour as part of fuel monitoring, including speeding, harsh braking, and rapid acceleration. A connected fleet fuel management approach can therefore help managers evaluate safety and efficiency together.
What Makes a Driver Safety Scorecard Unfair?
Using Raw Event Counts Alone: High-mileage drivers may appear worse simply because they have greater exposure.
Ignoring Driving Environment: Urban, long-haul, construction, and regional routes may create very different driving conditions.
Overweighting One Behaviour: One metric should not dominate the score without a clear risk-based reason.
Scoring Unverified Events: Incorrect sensor events can undermine driver trust in the program.
Using Too Little Data: Small samples can create extreme scores that do not represent normal behaviour.
Changing Rules Without Communication: Drivers should understand how they are measured and when the scoring model changes.
Using Scores Only for Punishment: A scorecard should support improvement, coaching, and recognition as well as accountability.
Ignoring Post-Coaching Progress: A historical incident should not permanently define a driver whose behaviour has improved.
Driver Safety Scorecard: Individual Driver vs Fleet-Level View
Individual Driver View
Fleet-Level View
Personal safety score
Fleet average safety score
Harsh braking rate
Fleet harsh braking rate
Speeding behaviour
Percentage of drivers exceeding threshold
Coaching history
Coaching completion rate
Improvement trend
Fleet trend over time
Peer-group position
Distribution of driver risk bands
Repeated behaviours
Most common unsafe fleet behaviours
Current priorities
Fleet-wide coaching priorities
Both views are important. The individual score guides coaching, while the fleet view helps management identify systemic patterns that may require policy, route, training, or operational changes.
How Can GPS Data Strengthen a Driver Safety Scorecard?
GPS data adds location, movement, and route context to safety events instead of leaving managers with an isolated alert.
1. Confirm Where the Event Happened
Managers can review whether repeated safety events occur on a specific road, route, delivery area, or operating environment.
2. Compare Event and Vehicle Movement
Location and movement information can help determine what the vehicle was doing around the time of the event.
3. Identify Recurring Route Risk
If several drivers generate similar events in the same area, the problem may require route review rather than individual coaching alone.
4. Support Fairer Investigation
Connected gps fleet tracking adds operational context to driver performance data rather than treating every event independently.Tachyon’s existing content also emphasizes that GPS alone does not provide complete operational visibility and becomes more valuable when combined with driver and fleet data.
How Can Drivers Be Included in the Safety Improvement Process?
1. Give Drivers Visibility Into Their Performance
Drivers should understand which behaviours affect their score and where improvement is expected.
2. Provide Event-Level Feedback
Specific event information gives drivers something concrete to review instead of receiving vague criticism.
3. Make Coaching Actionable
Each coaching session should end with a clear behaviour target for the next review period.
4. Show Improvement Over Time
Trend visibility helps drivers see whether changes in their driving are producing better results.
5. Recognize Strong Performance
Consistently safe drivers can be acknowledged alongside those receiving corrective coaching.
How Can TachyonFMS Support Driver Safety Monitoring?
TachyonFMS already includes driver behaviour monitoring within its wider fleet-management environment, with the current product page specifically referencing risky behaviours such as harsh braking and distraction.
1. Centralize Driver and Vehicle Visibility
Fleet managers can evaluate driver activity alongside wider fleet information rather than separating safety from vehicle operations.
2. Identify Risky Driving Behaviour
Driver monitoring can surface behaviours that require investigation, helping managers focus attention where intervention may be needed.
3. Connect Safety With Wider Fleet Performance
TachyonFMS also covers areas such as fuel, maintenance, expenses, and fleet activity, allowing managers to view driver performance in a broader operational context.
4. Build a More Structured Safety Process
When behavioural data is organized into consistent KPIs, trends, and coaching priorities, it can form the foundation for a repeatable driver safety scorecard.
Build a Scorecard That Improves Drivers, Not Just Rankings
A driver safety scorecard should help fleet managers find risk, understand why it is happening, and measure whether it improves. The objective is not to create a leaderboard from raw alerts, but to connect driver behaviour monitoring, harsh braking analysis, fleet safety KPIs, and coaching into one repeatable safety process.When a scorecard uses fair exposure measures, appropriate risk weighting, event context, and a structured driver coaching program, it becomes a practical management tool rather than another dashboard number.
FAQs About Driver Safety Scorecards
1. What Is a Driver Safety Scorecard?
A driver safety scorecard combines selected driving behaviours and safety KPIs into a consistent performance view that helps managers identify risk and track improvement.
2. What Metrics Should Be Included in a Driver Safety Scorecard?
Common metrics can include speeding, harsh braking, rapid acceleration, cornering, distraction, repeated events, coaching completion, and performance trends.The exact indicators should reflect the fleet’s vehicles, operating conditions, safety priorities, and available data.
3. How Should Harsh Braking Be Scored?
Harsh braking analysis should consider event frequency, driver exposure, severity, repetition, and available road context instead of relying only on the raw number of braking events.
4. Should Drivers Be Compared by Total Safety Events?
Not by total events alone. A fairer comparison accounts for differences in distance, driving hours, trips, or another measure of exposure.
5. How Does a Safety Score Help With Driver Coaching?
The score helps managers identify priority drivers and behaviours, while individual event data provides the evidence needed for focused coaching.
6. Which Fleet Safety KPIs Show Whether Coaching Works?
Useful fleet safety KPIs include repeat-event rate, post-coaching behaviour rate, safety-score trend, coaching completion, and the percentage of drivers improving over time.
7. Can GPS Tracking Improve Driver Safety Analysis?
Yes. GPS can add location and route context to safety events, helping managers determine whether the issue is driver-specific or linked to recurring road and route conditions.
8. Should a Driver Safety Score Be Used to Punish Drivers?
A scorecard is more effective as a performance-management tool that combines accountability with coaching, follow-up, and recognition for improvement.